

- You can view Email analytics and info in the MoEngage Go mobile app. Monitor performance stats, track conversions, and review campaign details right from your phone. For more information, refer to MoEngage Go.
- All the metrics are calculated and displayed in the App’s Timezone.
Overview
Navigation: Engage -> Campaigns -> Click on the row that displays the information about the campaign for which you wish to see the analytics information. The following sections are available on the screen that opens up:- Campaign Details - contains information about the campaign and its status. For more information, refer to Campaign Details.
- Analytics - contains information about the various metrics that are tracked for the campaign and has the following sections:
- Click analysis - contains information about the number of clicks on each link in the email. For more information, refer to Click Analysis.
- Info- contains information about the campaign’s target segment, content, preview, and delivery schedule. For more information, refer to Campaign Info.
Campaign Details
This section contains the following information:- Campaign type
- Campaign ID
- Campaign creation and updation details
- Team information
- Approver’s list/ Approved by/ Rejected by (if CAF is enabled)
- Campaign status - A campaign can have the following states: Active, Expired, Not Sent, Paused, Scheduled, Sending, Sent, and Stopped. If Campaign Approval Workflow (CAF) is enabled, two more states are possible for campaign status: Under_Review_ and Rejected.

Campaign Analytics
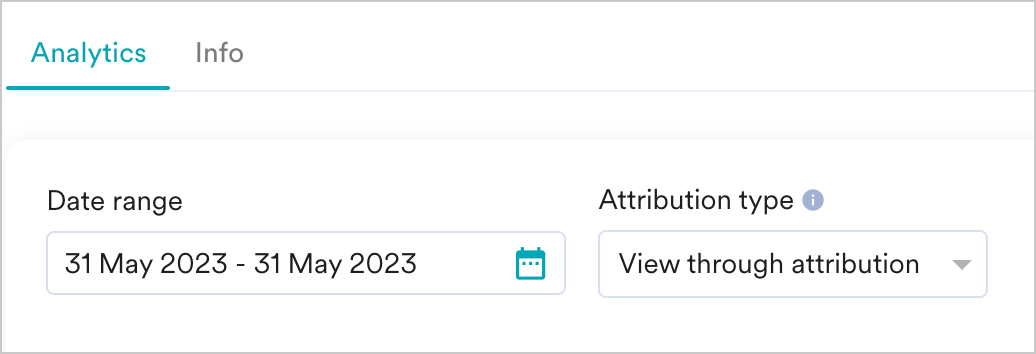
The analytics section contains information about the performance stats and revenue metrics. Global Analytics Filters These filters are applied to all the sections in the Analytics tab.- Date Range- Select the date range for which you want to view the performance stats.
- Attribution Type- Select the attribution type (Click through, In-session, and View through) to view the analytics information for the specified attribution type. The default attribution type is View through attribution. Refer to the paragraph below for information on attribution types. For more information, refer to the paragraph below.
- User A clicked on the message and did the conversion event within 30 minutes (we assume it to be the same session) of clicking.
- User B clicked on the message and did the conversion event 2-3 hours after clicking.
- User C saw your message, later launched the app directly, and made the conversion.
Attribution Window - Attribution Window is the duration calculated from the time a user receives or clicks the campaign having specific conversion goals. For example, two campaigns with a conversion goal as a purchase are created. Campaign C1 at time H hours and campaign C2 at H+12 hours. The customer achieves the conversion goal for purchase with the campaigns C1 and C2 at time H+15 hours. The conversion of customers is attributed both to C1 and C2.
In MoEngage campaigns, the maximum attribution window is 36 hours. When you send more than one campaign with a difference of less than 36 hours, then set the attribution window:
- Lesser than 36 hours
- With the duration difference in sending the campaigns.
Campaign Performance Stats
Campaign performance provides the impact of your email campaigns.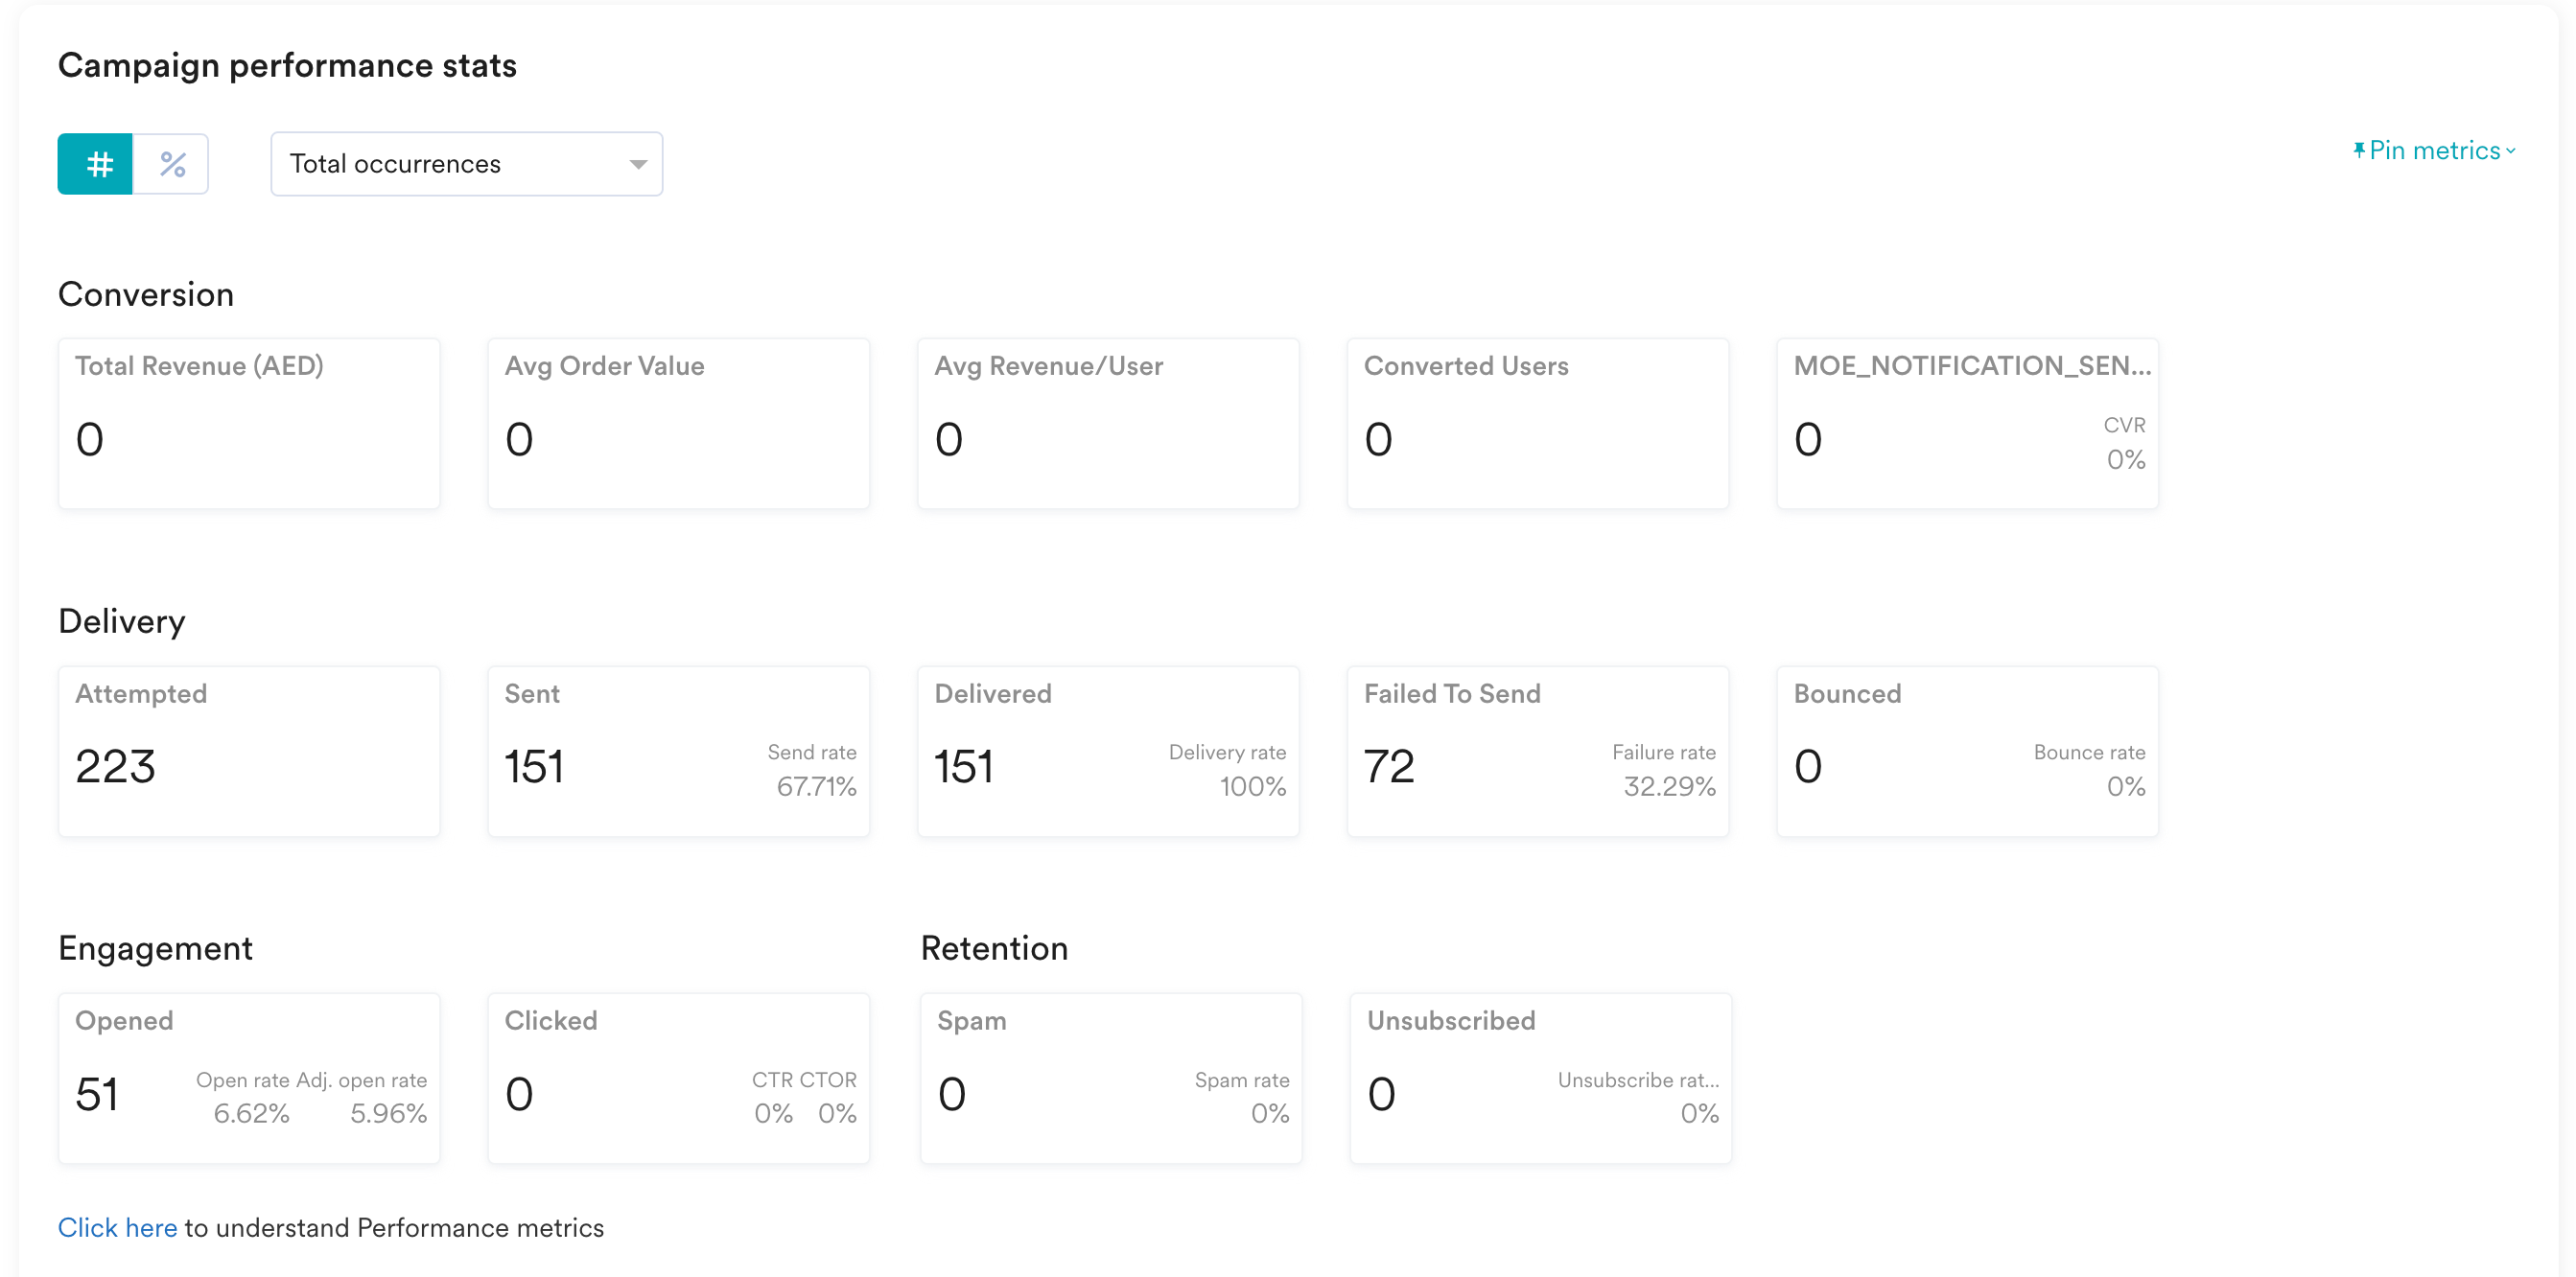
- Choose the number view or the percentage view to see the stats as numbers or percentage values.
- View the unique or total occurrences of stats by selecting Unique or Total in the dropdown at the top of the section.
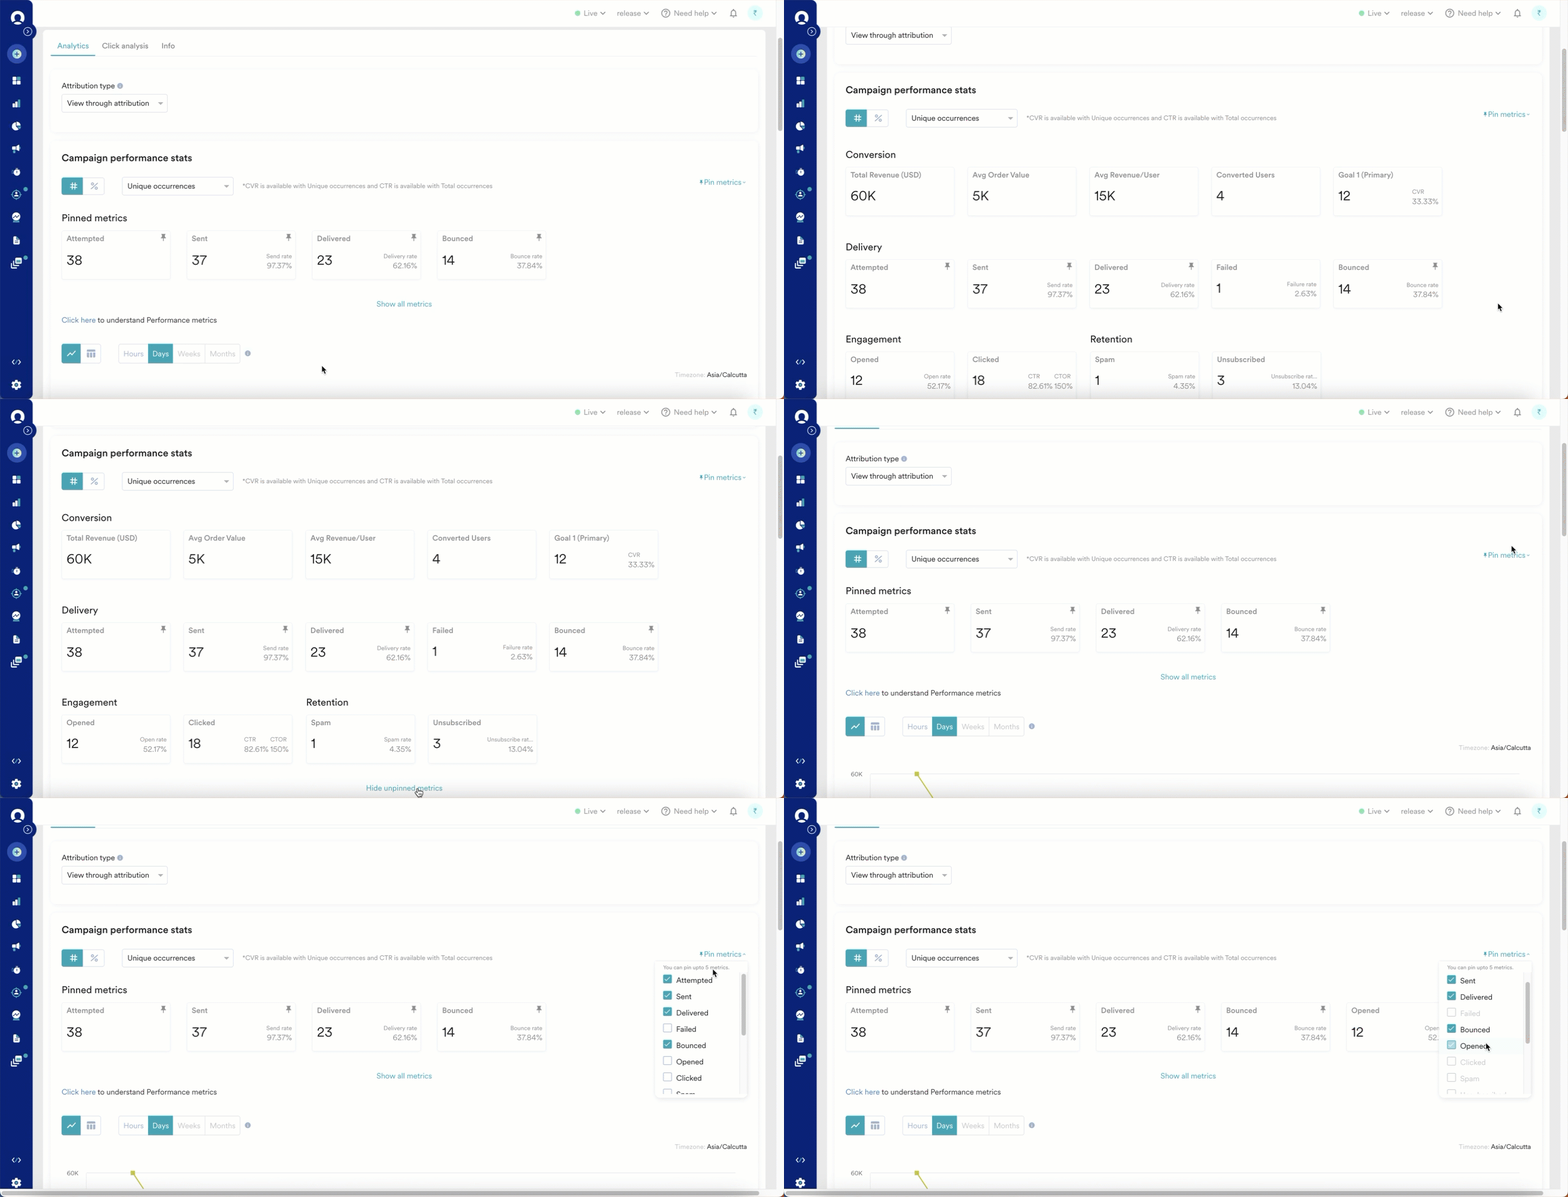
- Pin metrics - you can pin the metrics you want to see using the Pin metrics dropdown at the top right corner. You can pin up to five metrics. The selected metric pins are available in the Pinned Metrics section. Click _Show all metrics_to see all the metrics being tracked for the campaign and Hide unpinned metrics to see only the pinned metrics for the campaign.
- Conversion Metrics- These metrics pertain to the conversion goals set for the campaign. The higher these metrics, the more effective your campaign! The conversion metrics tracked for your email campaigns are shown in the table below.
- Delivery Metrics- The delivery metrics tracked for your email campaigns are described in the table below.
- Engagement Metrics- The engagement metrics tracked for your email campaigns are described in the table below.
- Retention Metrics - These metrics pertain to the number of users who have unsubscribed from receiving communications from your brand or have marked the email as spam. The retention metrics tracked for your email campaigns are described in the table below.
Locale/Variation Performance
You can see the breakdown of performance metrics (Opens, Adjusted Opens, Clicks, Conversions, Conversion goals, and so on) for each variation in the default locale. This helps you assess and compare the effectiveness of the variations. You can view the uplift percentage on the tabular view of Locale/Variation performance. For more information, refer to Uplift in Campaigns.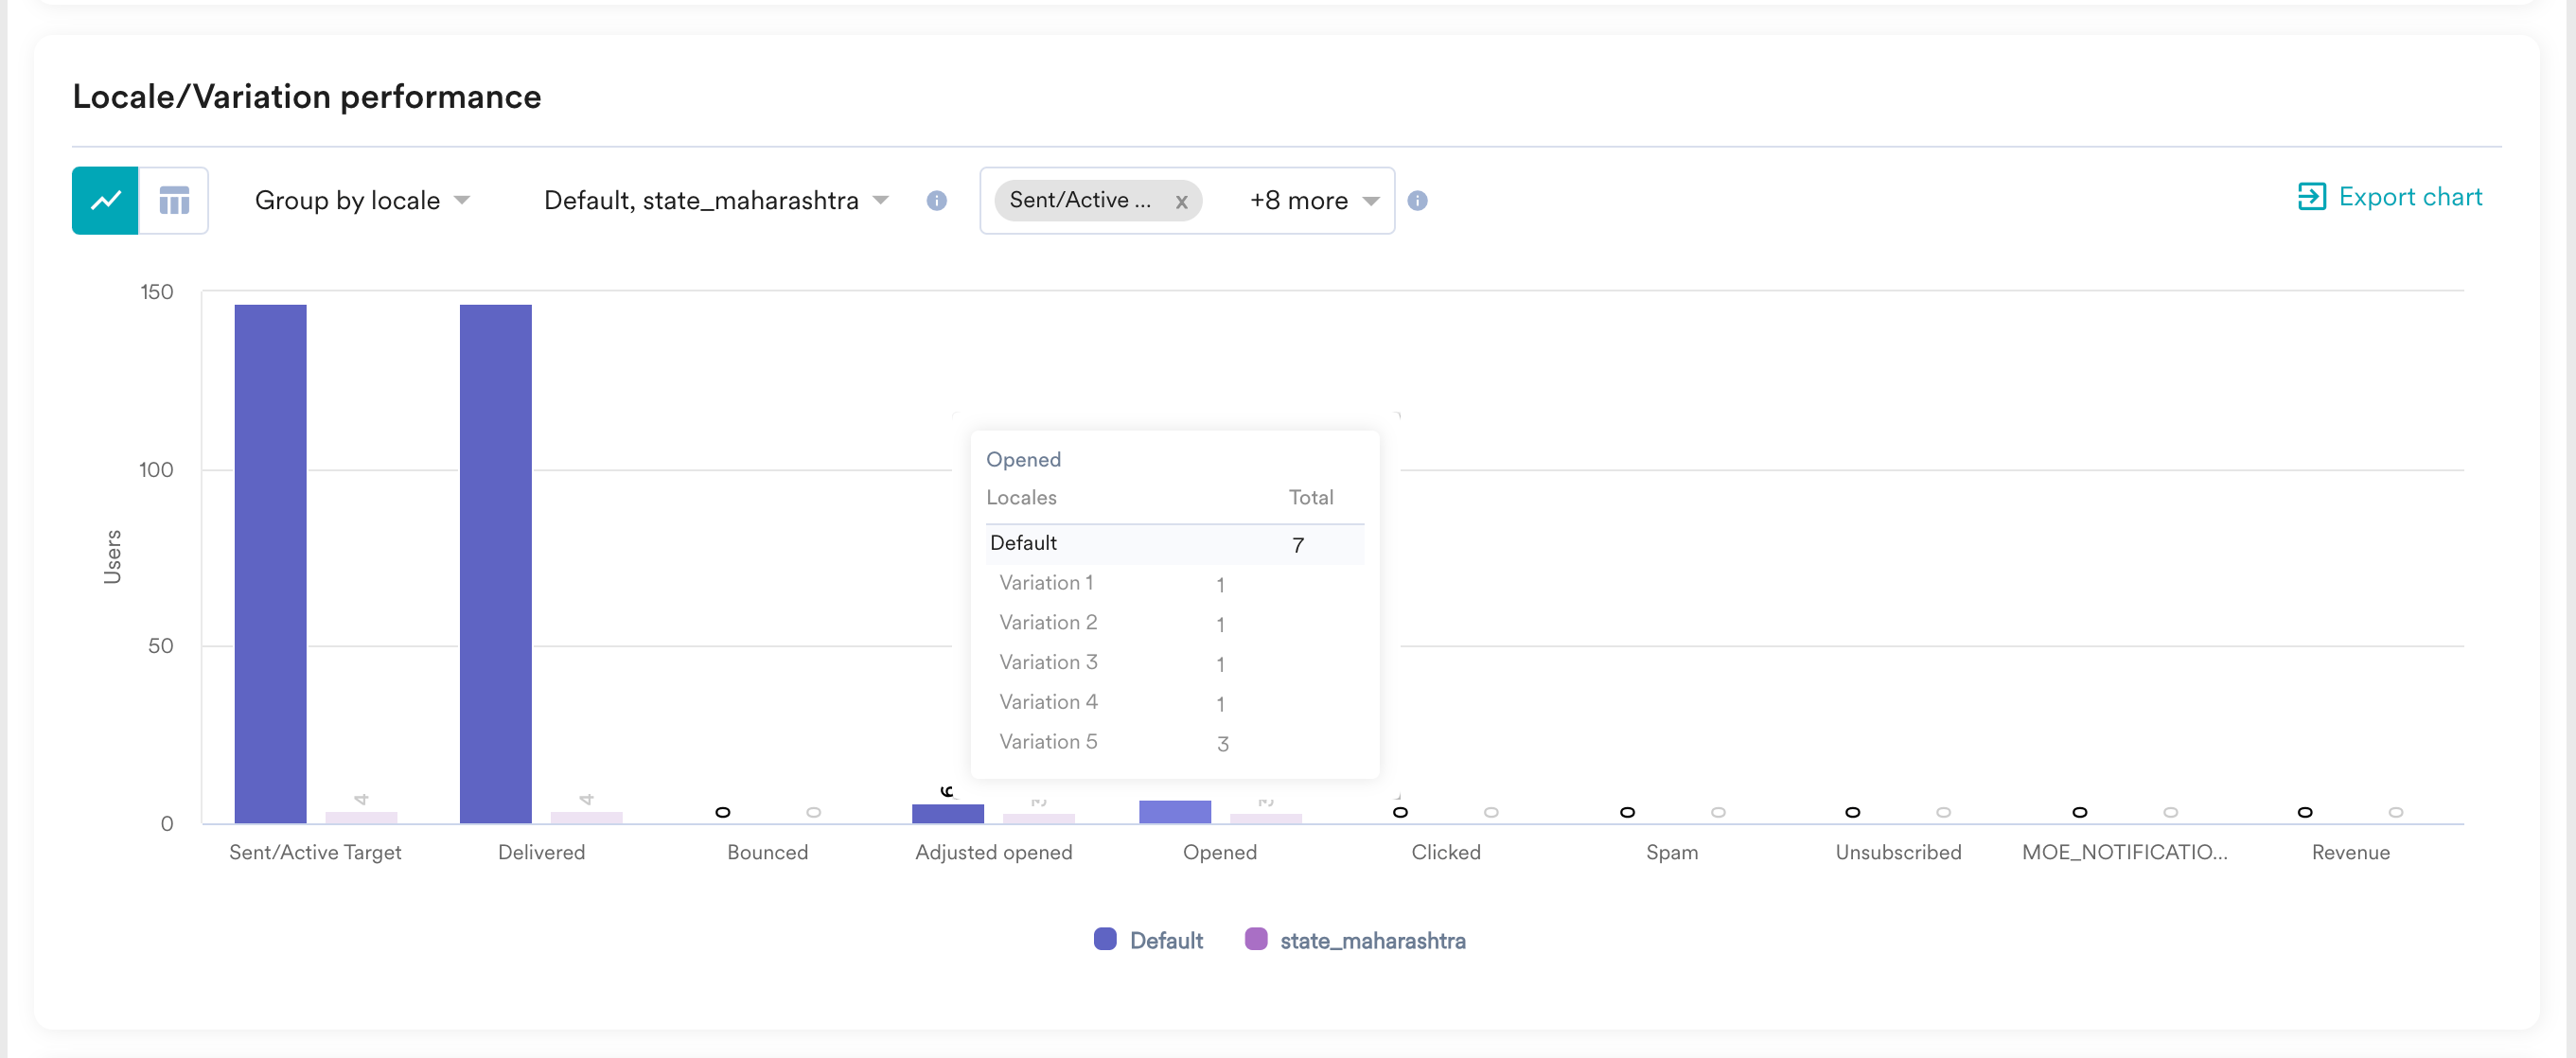
Conversion Goals Performance (uplift)
You will be able to see this section when you have set more than one conversion goal for your campaigns. The section compares the performance of goals set by the marketer for the campaign. Total Conversions: Will show all goal events for the respective goals i.e., if a user made a purchase twice, it will be shown twice. It is the equivalent of conversion events covered in the sections above. Unique Conversions: Goals are unique across the users converted per campaign instance. It is the equivalent of the Conversions metric covered in the sections above. You can view the uplift percentage in the tabular view of Conversion Goals performance. For more information, refer to Uplift in Campaigns.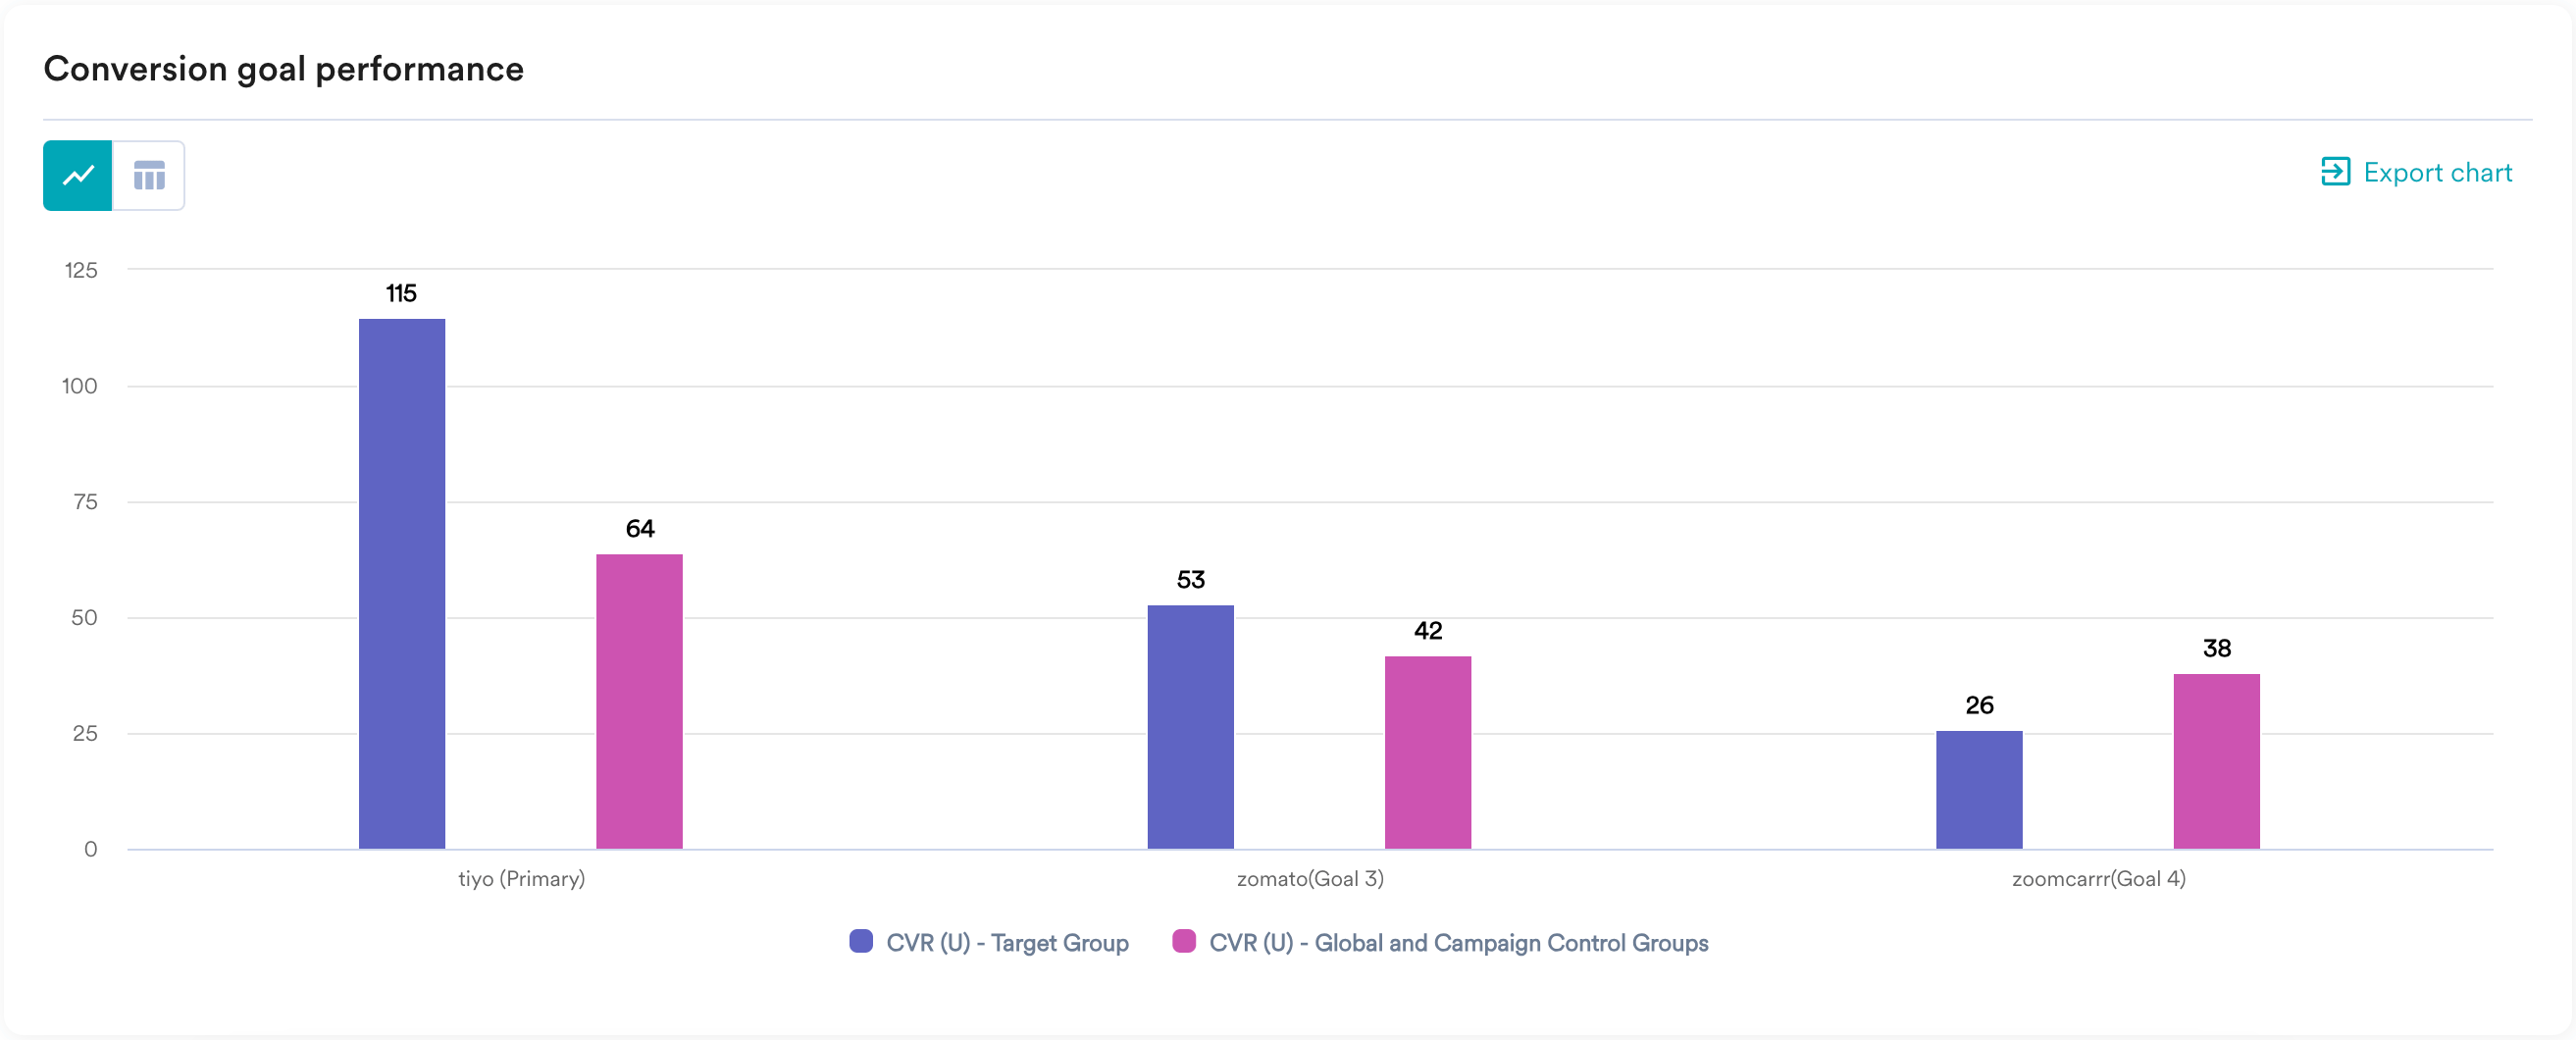
Campaign Delivery
The campaign delivery stats section helps you understand the delivery funnel and the number of users that were removed in each funnel stage.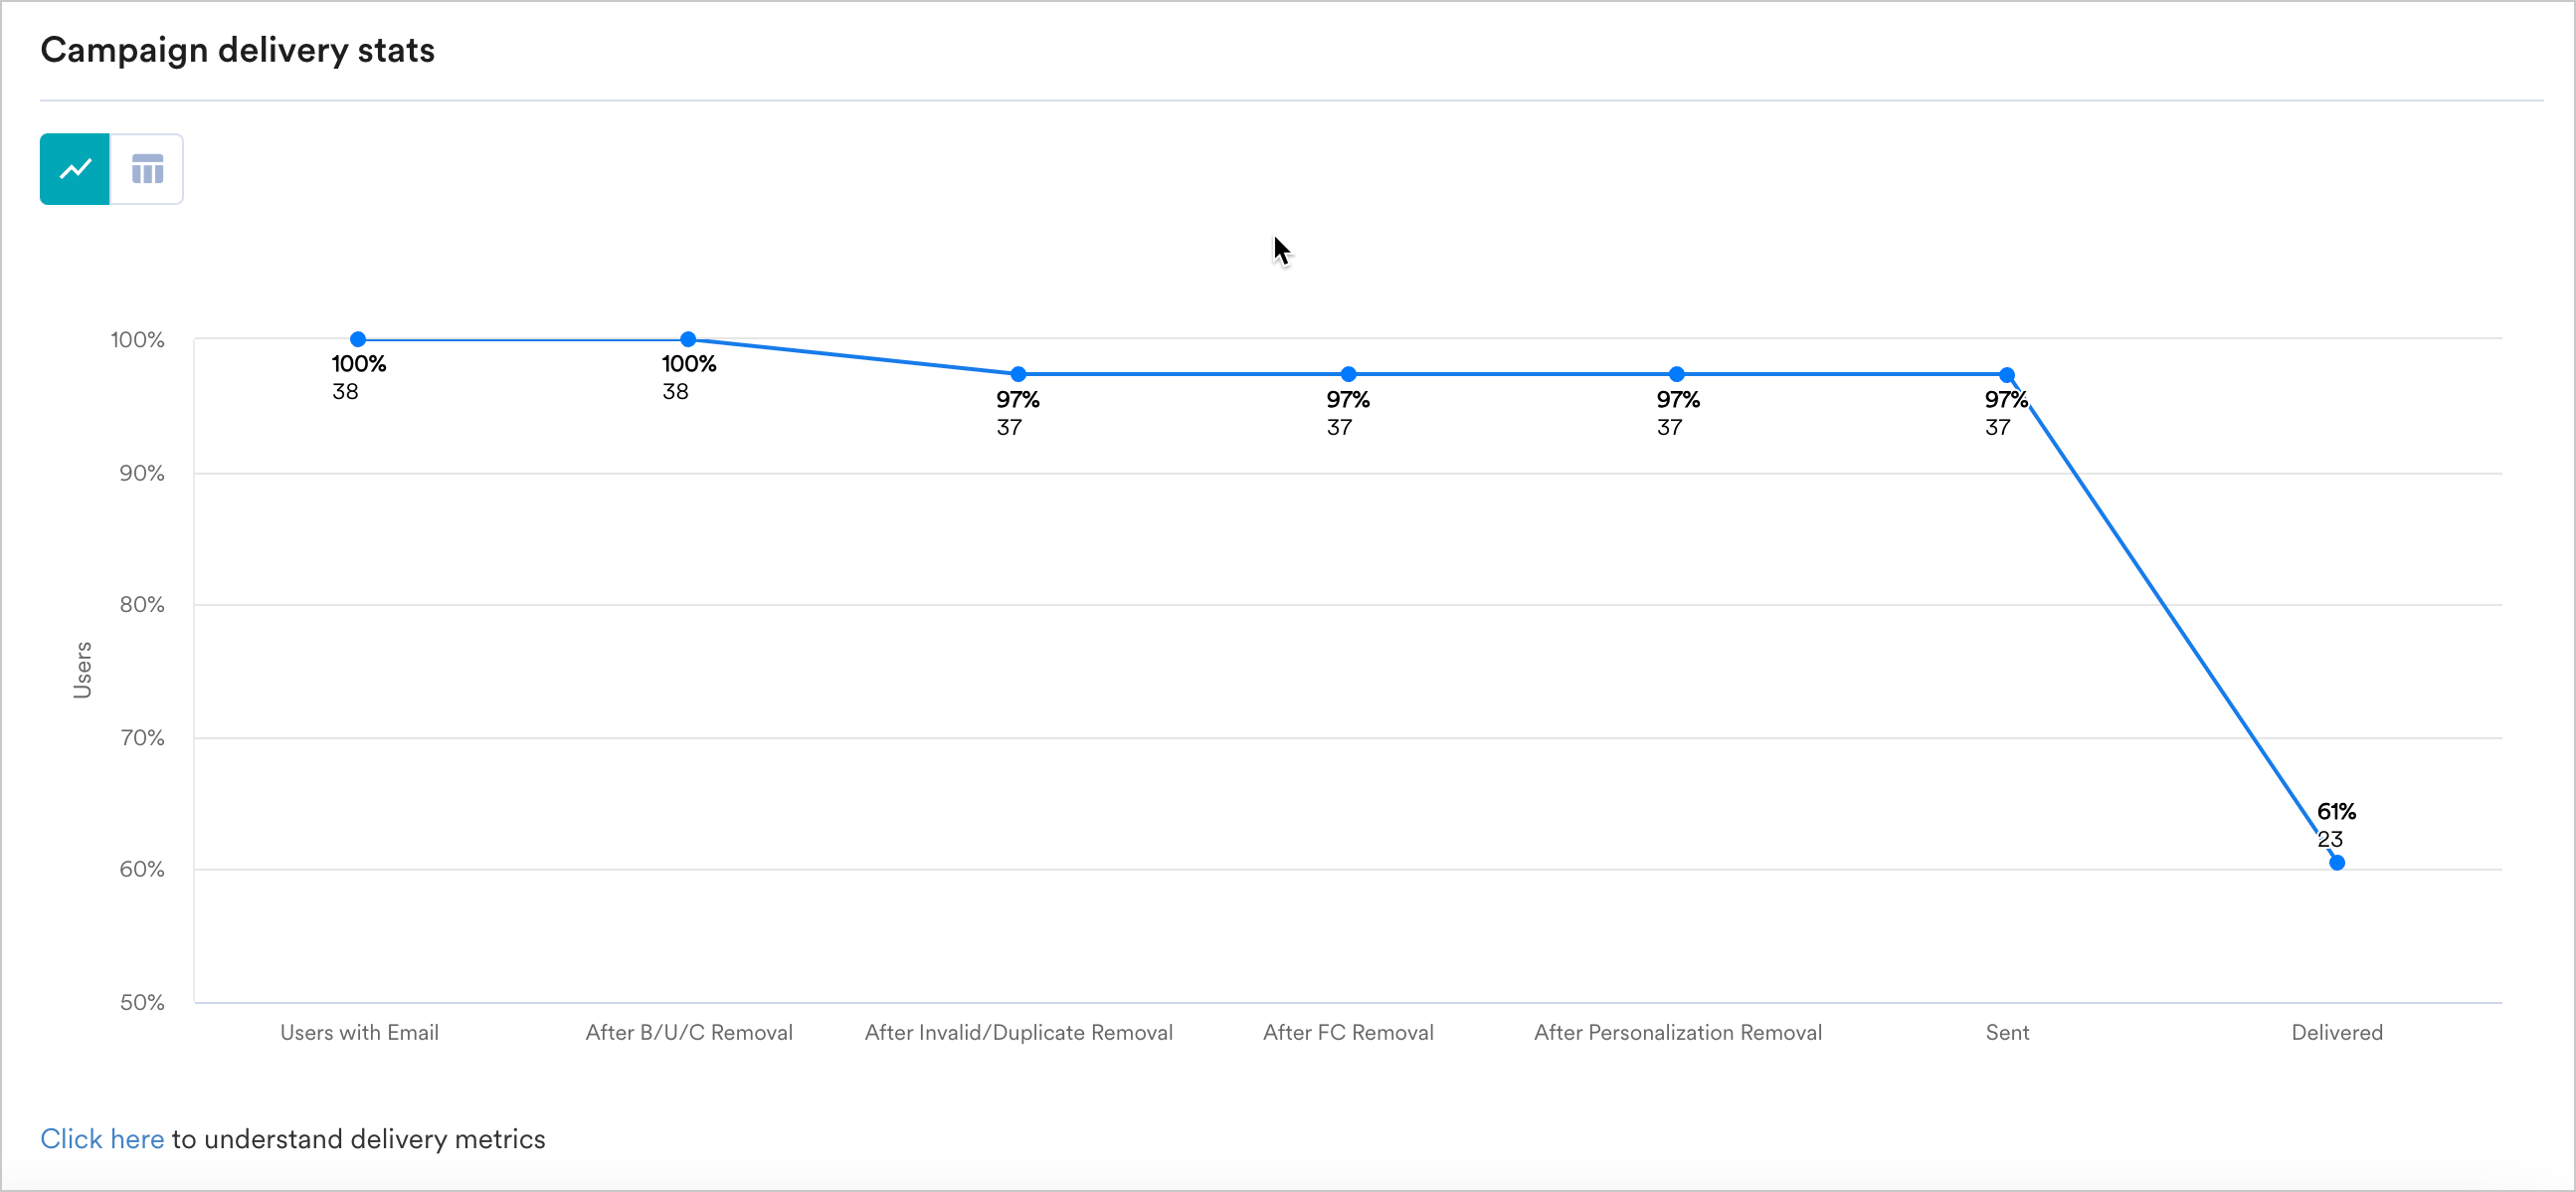
Error breakdown
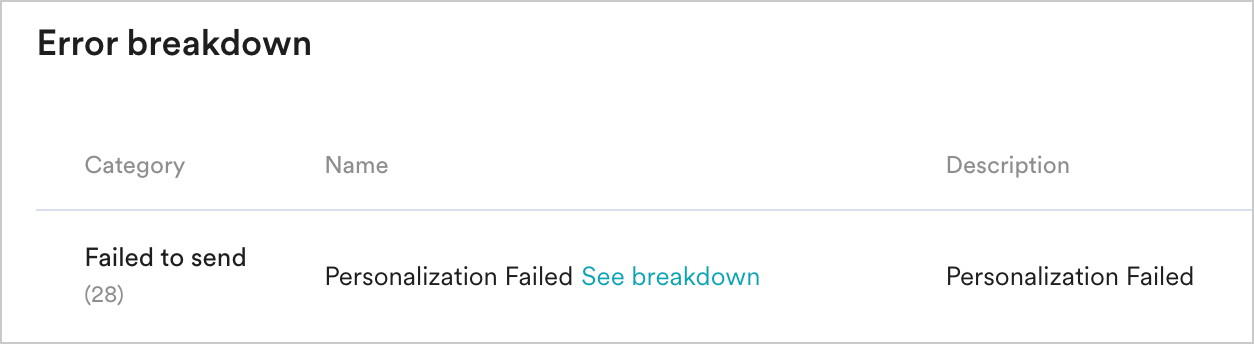
This section describes the various campaign delivery failures and their reasons. Errors are categorized under the following heads:- Failed to Send errors - these errors happen when the email has not been sent, and they could happen due to one of these reasons:
- Failed to Deliver errors - these errors happen when the email was sent by MoEngage but could not be delivered to the user. This could happen due to any of the following reasons:
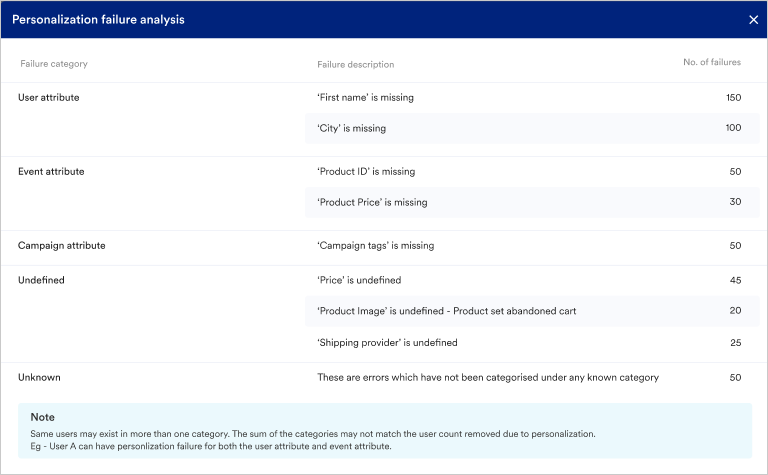
Note: The number of failures listed in the Personalization Failed category under Failed to Send denotes the unique number of users for whom personalization has failed. In some cases, this might differ from the count shown in the Personalization failure analysis UI as multiple failures can happen for the same user, and they might be counted under each of the failure categories shown in the UI. For example, if a user were to have a user attribute and event attribute failure, they would be counted for the number of failures in both these sections in the analysis screen while they would be counted as one in the Personalization Failed section.
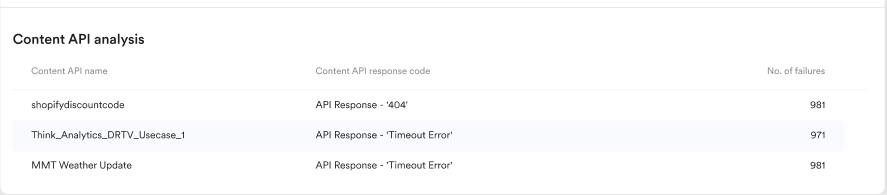
If the Content API being used in the campaign does not provide a 2xx/successful response, campaigns might still be delivered if the empty response has been handled in your JINJA code added in Step 2 of Campaign Creation (the content/message creation step).
Click Analysis
Click analysis and tracking help you understand which Call-to-actions (CTAs) work and can help you hone your email marketing strategy. You can view the performance of each link in your email and understand what works well and what doesn’t with Click Analysis. Note:- MoEngage tracks any URLs inside
<a>or<area>tags only. URLs inside any other tag will not be tracked by MoEngage. - “Mailto:” URLs are not tracked by MoEngage.
Click Map
A click map shows the links available on your email using a preview. In this section, you can:- view a heat map that helps you understand which links have performed better than others. Every link is named with Link# (where # represents a number. The first link for example, would be called Link1).
- hover over a link to view the link name, unique and total clicks.
- click on the link in the heat map. This will highlight the details about the link in the click breakdown table.
- see a click breakdown table that has the following information:
- You can click on each link to view the link and no. of clicks (unique & total) that occurred on that CTA. You can also export this preview along with click data a pdf by clicking on the printer icon.

Device Analysis
This is an Early Access feature. To enable it for your account, contact your MoEngage Customer Success Manager (CSM) or the Support team.
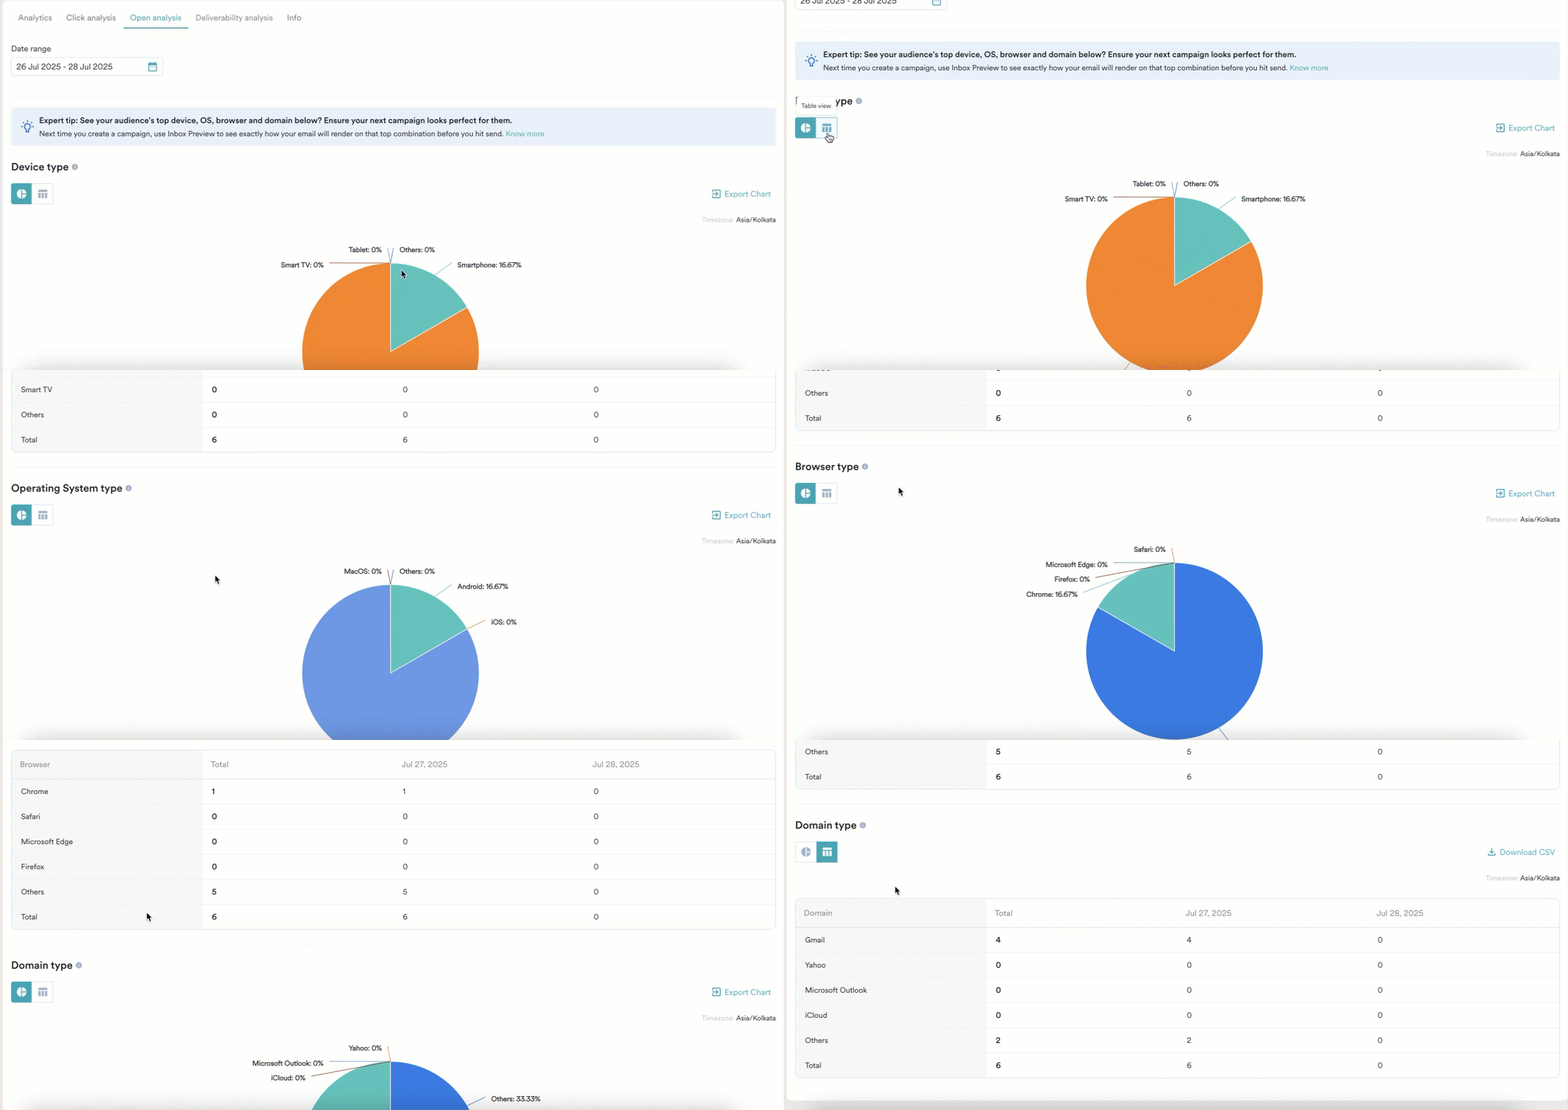
- Optimize email rendering: Identify the dominant browsers, devices, and operating systems used by your audience. This insight enables you to prioritize testing and ensure your emails render correctly, providing an optimal viewing experience on those platforms. For instance, if you’re planning a campaign primarily targeting mobile users, device analysis can show you the most popular mobile devices and operating systems, guiding your design and testing efforts.
- Improve conversion: By optimizing for your audience’s preferred platforms, you can enhance user experience, leading to better engagement and higher conversion rates.
- Leverage inbox preview: Use the Inbox Preview feature in conjunction with Device Analysis to fine-tune your email designs based on the insights gained, ensuring your emails look great on the platforms your users prefer. This is especially useful when you notice a dip in engagement for a specific email client and need to troubleshoot rendering issues.
Key Features of Device Analysis
- The device analysis information is populated within the Email Clicked event. You can use this event to segment users who open emails from a specific browser, device, OS, or domain type.
- MoEngage uses Total Clicks to populate these categories. This ensures all the different environments from which a single user might click your email are captured. For example, if User A clicks an email from both a desktop and a phone, the data shows a 50% distribution for both Desktop and Mobile under the Device Type category, attributed by User A’s activity.
- If you require any other Browser Type, Device Type, OS Type, or Domain Type values apart from those currently provided by MoEngage, contact your MoEngage Customer Success Manager (CSM) or the Support team.
- MoEngage groups email clicks into the following four categories:
- Browser Type: Indicates the web browsers used to click emails. Examples include Chrome, Safari, Firefox, and Others (representing browsers used less frequently).
- Device Type: Indicates the types of devices used to click emails. Examples include Mobile, Tablet, Desktop/Laptop, Smart TV, and Others (representing device types used less frequently).
- OS Type: Indicates the operating systems on which emails are clicked. Examples include Android, iOS, Windows, macOS, and Others (representing OS types used less frequently).
- Domain Type: Indicates the email clients or service providers. Examples include Gmail, Outlook, Yahoo, and Others (representing domain types used less frequently).
- View the device analysis data in the following two formats:
- Pie Charts: Provide a quick visual overview of the distribution across categories. You can also export images of the charts.
- Tables: Offer detailed, granular data, particularly useful for viewing specific versions of OS or Browser types.
- Download the CSV file of the device analysis data for further offline analysis and reporting.
- Filter the data by date range and locale for granular analysis, helping you understand deliverability performance over time and for specific user groups.
Deliverability Analysis
This is an Early Access feature. To enable it for your account, contact your MoEngage Customer Success Manager (CSM) or the Support team.
- Identify problem areas: Quickly pinpoint domains where deliverability is consistently low. For instance, if you observe a significantly lower delivery rate for Yahoo users, it indicates a potential issue specific to that domain.
- Improve delivery rates: Armed with this granular information, you can take targeted actions to improve your email delivery rates for specific domains, such as adjusting sending practices, reviewing content for spam triggers, or working with MoEngage support.
- Understand engagement: The breakdown of opened, clicked, and converted rates by domain also helps you understand user engagement patterns across different email providers.
Key Features of Deliverability Analysis
- The deliverability analysis information is populated within all email events, including Email Sent, Email Delivered, and Email Opened. You can use this event to segment users based on their email domains.
- If you require any other domain categories apart from those currently provided by MoEngage, contact your MoEngage Customer Success Manager (CSM) or the Support team.
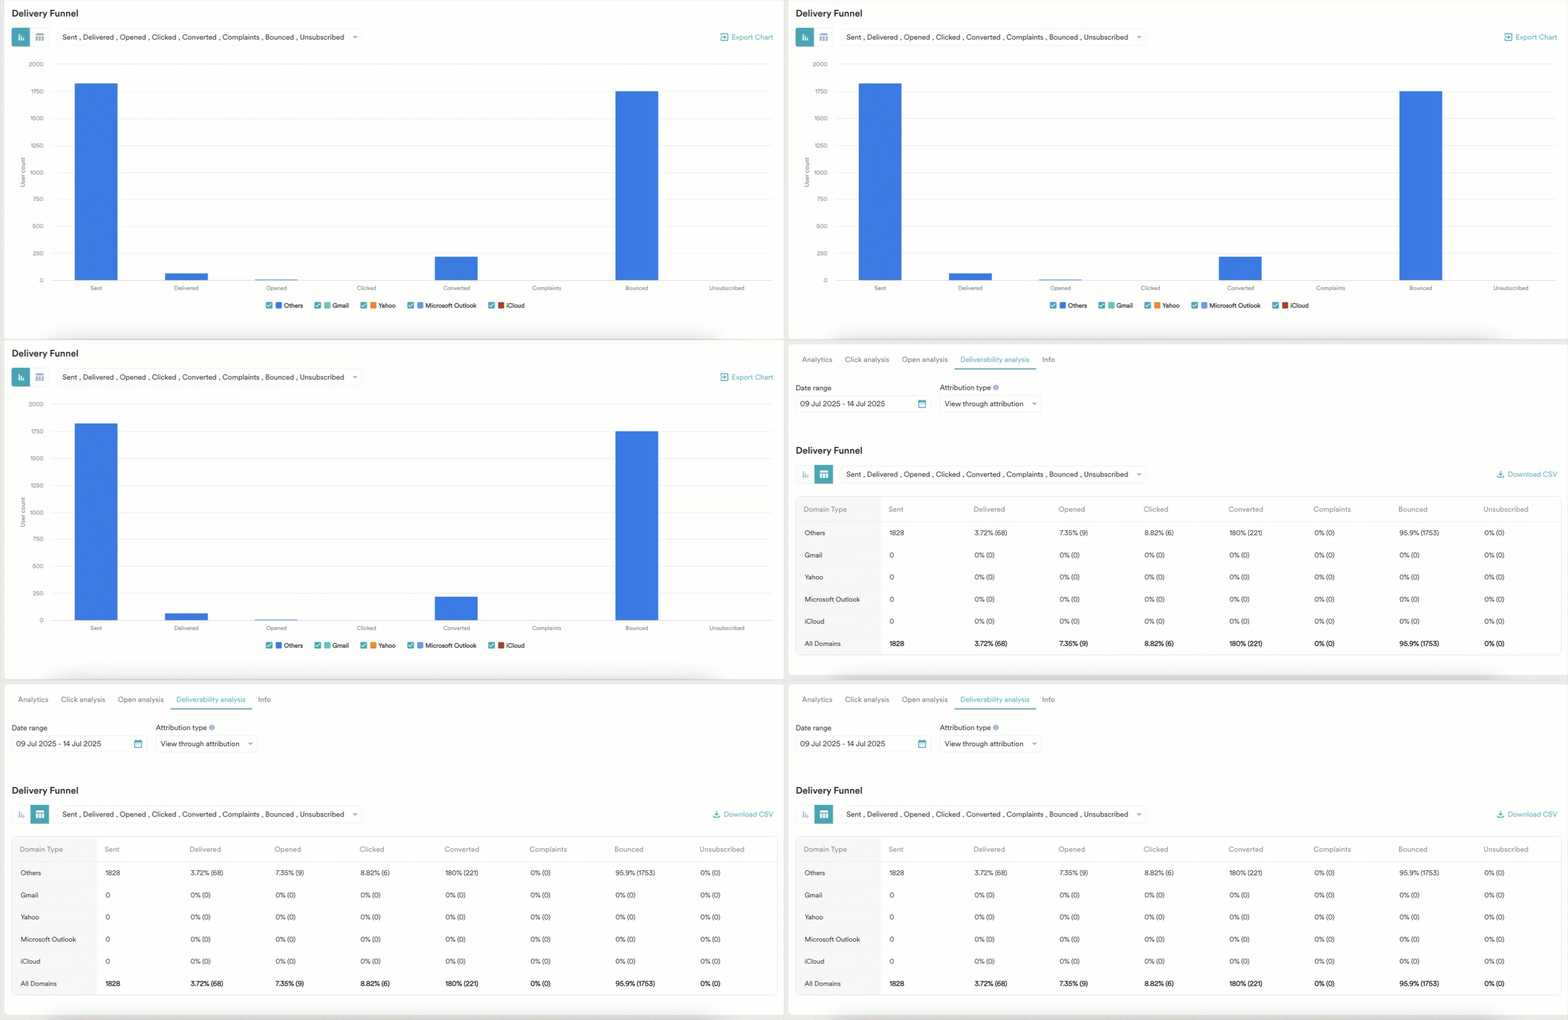
- Comprehensive delivery funnel metrics: Gain insights into various aspects of your email delivery, including: Sent, Delivered, Opened, Clicked, Converted, Unsubscribed, Hard Bounce, Soft Bounce, and Spam.
- Domain-wise breakdown: All data is presented in a detailed table format, broken down by major email domains such as All domains, Gmail, Outlook, Yahoo, Apple, and Others (includes domains that are treated as less frequent or less significant). This allows you to pinpoint domain-specific performance and identify where issues may be occurring.
- Absolute values and percentages: Key metrics like Attempted, Sent, Delivered, Opened, Clicked, and Converted are displayed as both absolute values (e.g., the total number of emails) and percentages (e.g., delivery rate, open rate, bounce rate), providing a complete picture of your campaign’s performance.
- Visual delivery funnel chart: A stacked bar chart visually represents the delivery funnel across different domains, allowing for quick comparison and identification of trends. You can also export charts for sharing or further analysis.
- Data download: You can download the CSV file of the analysis data for detailed offline review and integration with other reports.
- Date and locale filtering: Filter the data by date range and locale for granular analysis, helping you understand deliverability performance over time and for specific user groups.
Campaign Info
You can view the information about the campaign sent using the Campaign Info tab.- Timeline
- Audience
- Trigger criteria
- Scheduling
- Conversion Goals
Timeline indicates the time taken for various stages in publishing the campaign and gives a view of the current state of the campaign. This section is available for One Time and Periodic campaigns and contains information about the following: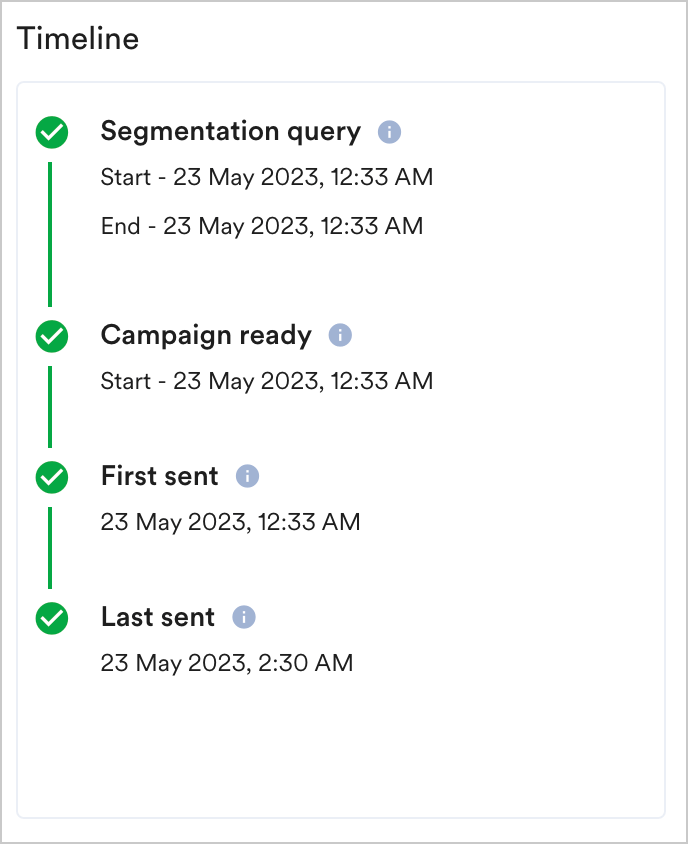
- Segmentation query: Contains information about when the segmentation query was started and when it was completed.
- Campaign ready: Contains information about when the campaign was ready to be sent out from MoEngage after the required internal processing. For ASAP campaigns, this time represents the campaign sending time.
- First sent: Contains information about when the first batch of emails was sent from MoEngage and when the first email was sent.
- Last sent: Contains information about when the last email was sent for the campaign.

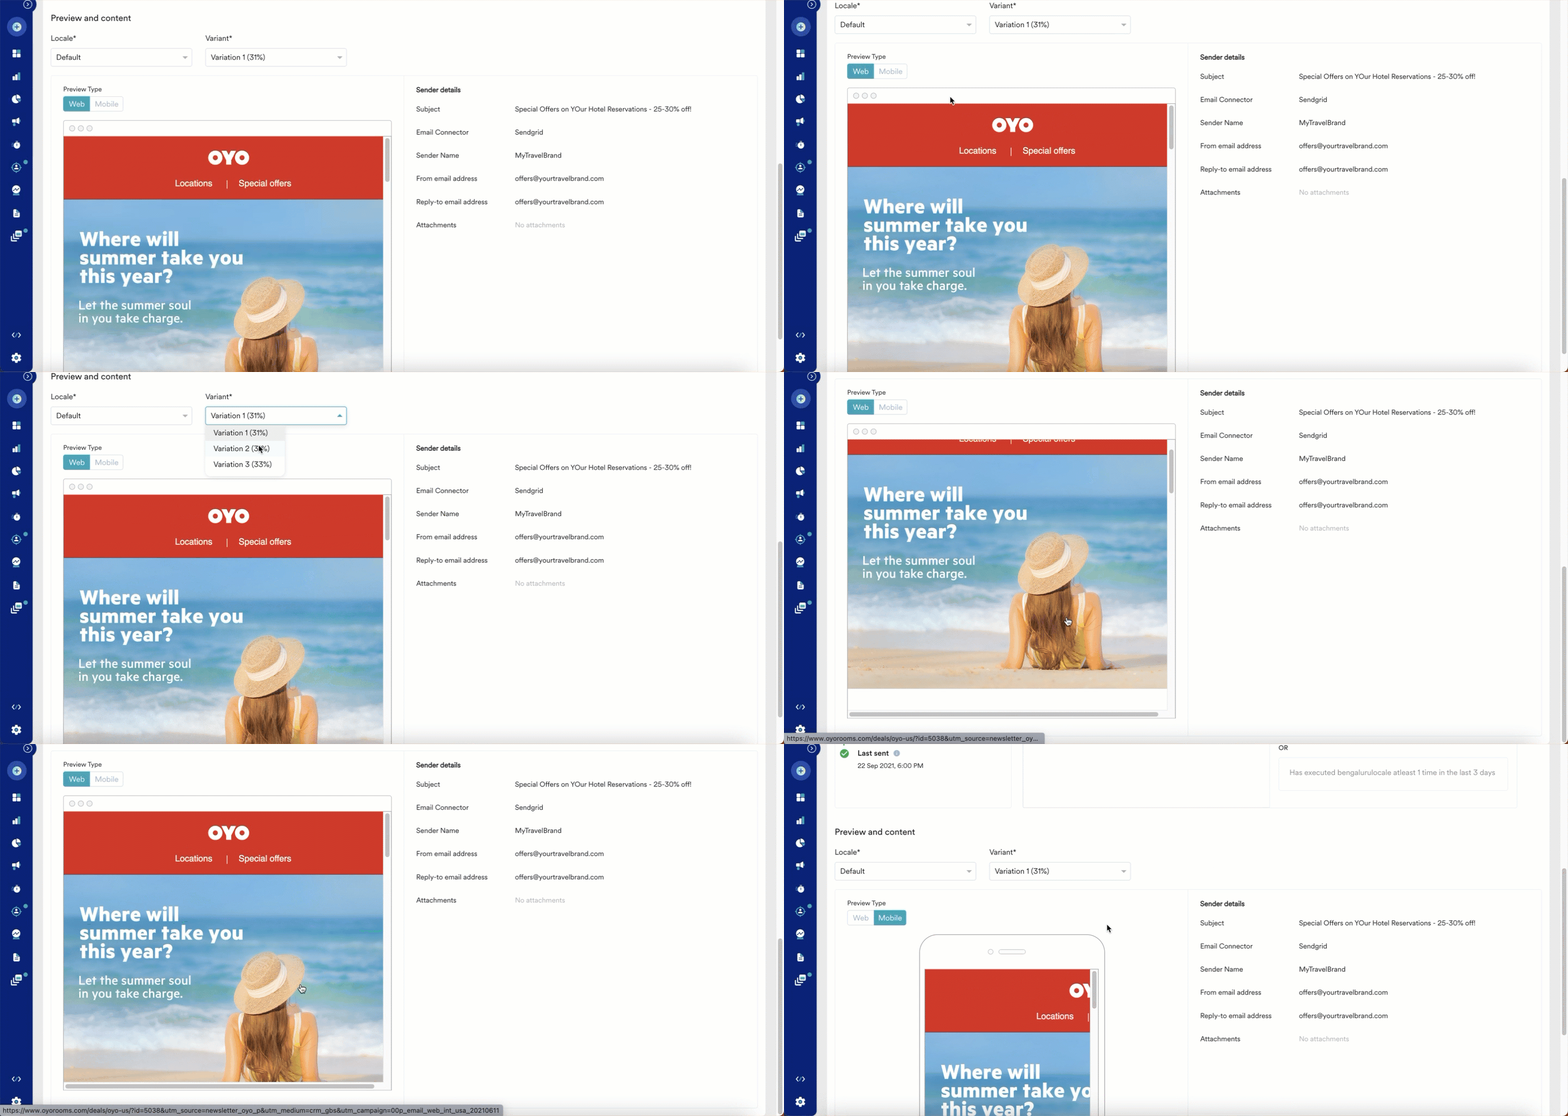
Preview and Content
You can preview the email in either the Web or Mobile mode here for each locale and variation. The following details are available apart from the preview of the email:- Subject
- Preview Text (if available)
- CC/BCC (if available)
- Email Connector
- Sender Name
- From email address
- Reply-to email address
- Attachments
FAQs
Do email tracking links and pixels ever expire in MoEngage? How long do they remain active?
Do email tracking links and pixels ever expire in MoEngage? How long do they remain active?
No, generally, email tracking links and open tracking pixels in MoEngage do not expire. They are designed to remain active indefinitely, allowing for ongoing event tracking and campaign stat updates.
Are there any scenarios where email tracking data might not flow back into MoEngage, even if the link is clicked or the email is opened?
Are there any scenarios where email tracking data might not flow back into MoEngage, even if the link is clicked or the email is opened?
Yes, there are a few specific scenarios where tracking data might fail to flow back into MoEngage:
- Expired SSL certificate for link branding: If you are managing your own custom link branding (e.g., links.yourdomain.com) and the associated SSL certificate expires, the tracking might break. For MoEngage-managed link branding, SSL certificates are automatically renewed, so this typically isn’t a concern.
- Use of shortened links: While rarely enabled for email, if a link was shortened (which is more common for SMS or WhatsApp where character limits are strict), these shortened links do expire after 2 weeks. This is a specific use case and not the default for email.
- Open tracking pixel issues:
- If the open tracking pixel, which is a small image, is placed at the very bottom of a large email, some email clients might “clip” the email content, preventing the pixel from loading and sending back the open event.
- If the email recipient has disabled automatic image downloading in their email client, the tracking pixel will not load, and an open event will not be recorded.
- Firewalls or Security tools (Common in B2B): In some cases, particularly with B2B users, corporate firewalls or advanced security tools might block MoEngage’s tracking links or prevent the open tracking pixel from loading. This can lead to opens not being tracked and even clicks being blocked.